THE QUESTION
What does a school rating tell us—and what does it leave out?
What you can explore
- Search Texas campuses and districts.
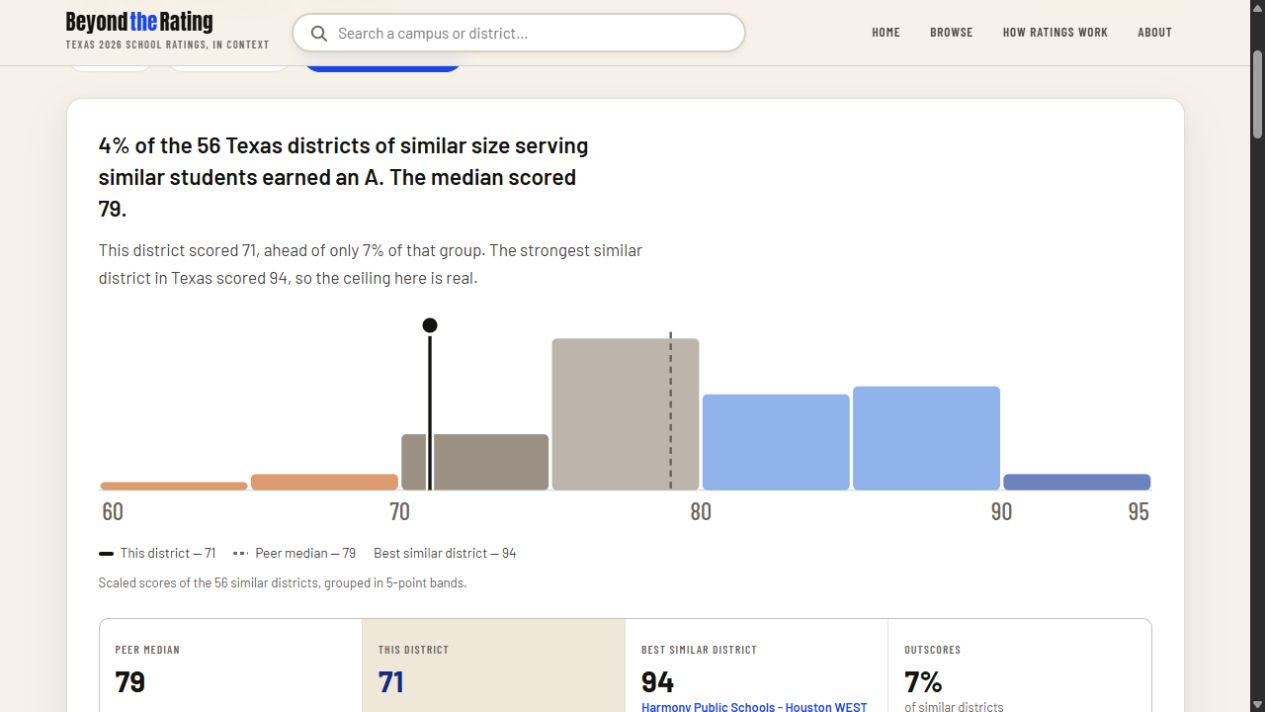
- Explore rating distributions among schools serving similar students.
- Unpack the domain scores behind an overall A–F grade.
A deliberate choice
Make the comparison method visible alongside the result. For regular campuses, peer matching considers campus type, grade span, economic disadvantage, mobility, and enrollment.
What it is built on
The site uses TEA’s 2026 District and Campus Accountability Summary files. The published ratings come from TEA; peer groups and explanations are the project’s own analytical layer.
KEEP IN VIEW
What this can’t tell you
A one-year comparison is not causal evidence. Some peer groups are small or broad, and special campus classifications need different treatment. A rating is one piece of a school’s story.
AI, with verification
The project’s About page describes substantial AI assistance and emphasizes checking the resulting work against public source data. AI involvement is part of the process; the published data and explicit method are what readers can inspect.
Read the project’s disclosure ↗This overview describes the public tool reviewed in September 2026. It does not claim measured classroom impact or independent evaluation of the project.